How to make a pie chart
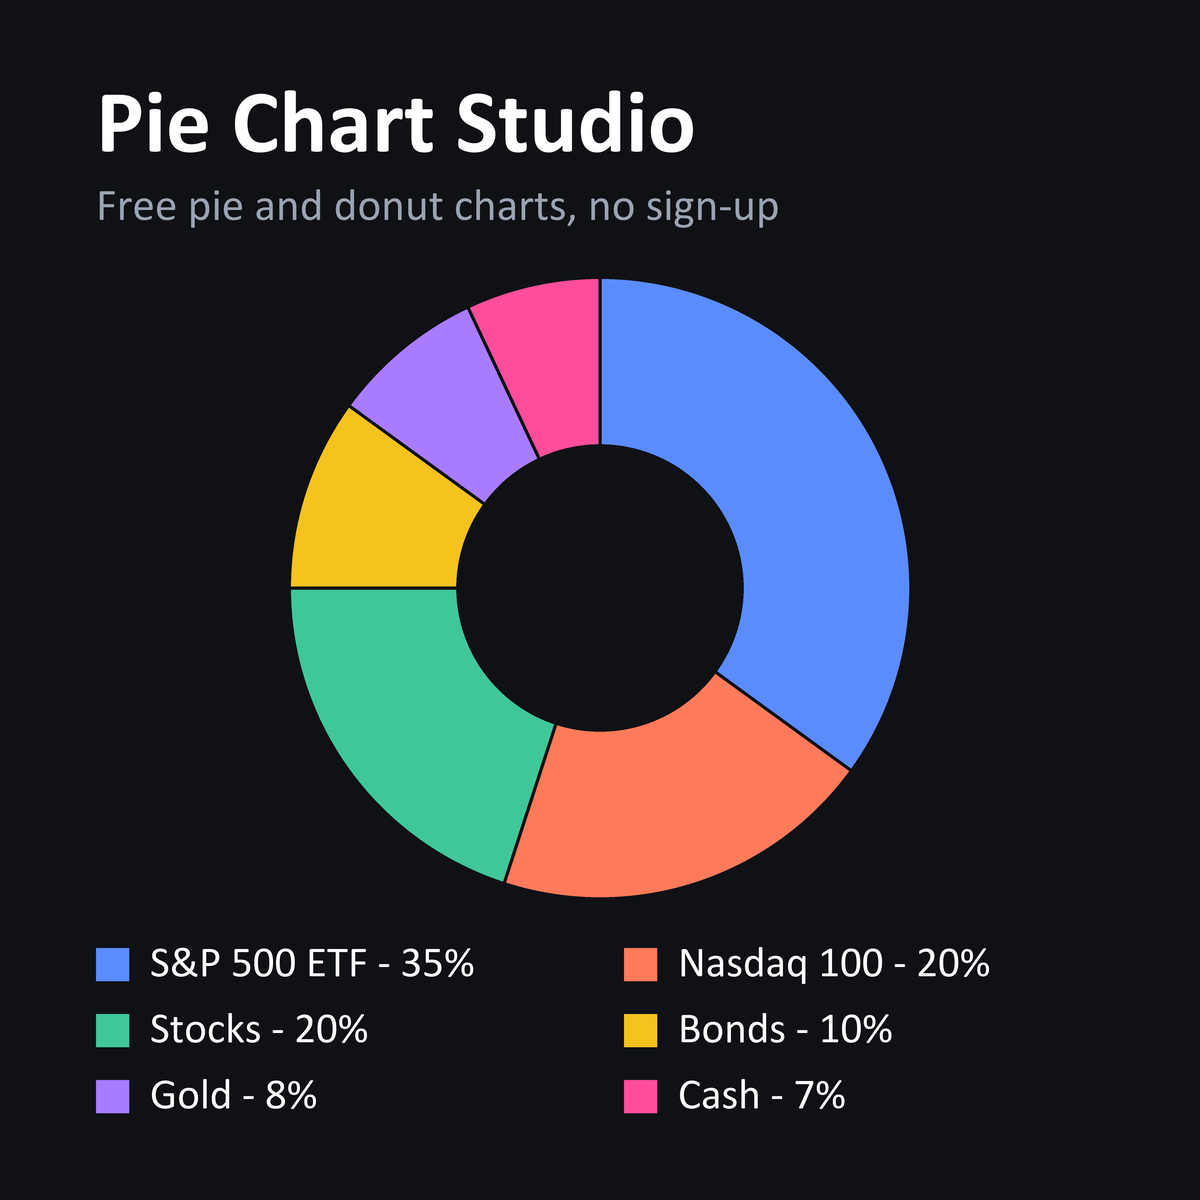
Pie Chart Studio runs entirely in your browser. Nothing is uploaded, there is no account, and your work is saved locally as you go.
1. Enter your data
Click Import / Paste data and paste one slice per line as Name, Value. You can copy straight out of Excel or Google Sheets:
- Commas, tabs, semicolons and colons all work as separators.
- Values can be money, percentages, shares or plain numbers - keep every row in the same unit.
- Both
1,250.50and12.500,75number formats are read correctly.
You can also load a .csv file, or skip the import and press + Add slice to build the chart by hand.
2. Edit directly on the chart
The chart itself is the editor. There is no long list of form fields to hunt through:
- Click a slice to select it. A contextual Slice Tools tab appears with its name, value, colour, border and position.
- Drag a slice edge to resize it. Value moves between the two neighbouring slices, so the total stays fixed and your percentages keep their meaning.
- Drag a slice outward to pull it out of the pie for emphasis.
- Click a label to rename it in place. Press Enter to confirm or Esc to cancel.
- Drag a label to move it anywhere around the chart. Labels cannot be dropped on top of the pie itself.
- Split in two, in Slice Tools, cuts the selected slice into two equal halves. The total stays the same, so the rest of the chart does not move.
- Press Delete or Backspace to remove the selected slice.
- Press Ctrl+Z to undo and Ctrl+Y to redo.
3. Change the look
The ribbon at the top is grouped like a familiar office app:
- Home - add slices, set the title and subtitle, pick a colour palette.
- Design - donut hole, slice gaps, start angle, direction, canvas size, background and border.
- Labels - label placement, percentages or raw values, decimals, font size, legend.
To turn a pie into a donut chart, drag the Hole slider in the Design tab. Add Center text on the Home tab to put a total in the middle.
4. Export
Download PNG gives you a raster image at twice the on-screen size, ready for a slide deck or a document. SVG gives you a vector file that stays sharp at any size and can be edited later in Illustrator, Figma or Inkscape.
Tick Transparent in the Design tab if you want the chart to sit on a coloured background.
Why use this instead of Canva or Google Charts?
Most chart tools online want something from you before they draw anything: an account, an email address, a subscription for the export without a watermark, or a live connection to their servers. Pie Chart Studio is deliberately the opposite.
- No sign-up and no account. Open the page and start. Nothing to register, no email to confirm, no free trial that expires.
- No watermark. Exports are clean at any size, and the charts are yours to use commercially.
- Works offline. Once loaded, the page needs no connection. Save it to disk and it keeps working on a plane or behind a locked-down office network.
- Your data stays with you. Figures are never uploaded, which matters when the numbers are financial, medical or under NDA.
- One job, done properly. No sprawling design suite to learn - just pie and donut charts, edited by clicking the chart itself.
The trade-off is honest: if you need bar charts, line graphs, team collaboration or cloud sync, a full design suite will serve you better. If you need a clean pie chart in under a minute, this is faster.
Saving your work
Your current chart is saved automatically in this browser, so closing the tab will not lose it. Use Save to keep several named charts and Load to bring one back. Because storage is local to your browser, saved charts do not follow you to another device.